Introduction
X-ray diffraction (XRD) is one of the structural analysis methods commonly used for the characterization of materials as a function of environment, temperature and other external conditions. Phase transitions occur when materials undergo thermal cycles (at low or high temperatures), and there can be a significant change in their crystal structures, resulting in various properties of materials.
The real-time detector technology of the Thermo Scientific™ ARL™ EQUINOX 100 enables a user to carry out rapid XRD measurements for the analysis of structural phase transitions of materials at high temperature. The recent addition of a compact high-temperature chamber, developed to be integrated inside a bench-top XRD instrument and coupled with a simultaneous full pattern XRD capability, facilitates dynamic studies to be performed at a high temperature, considerably faster and in a more convenient manner.
This article describes an example of such an analysis using the ARL EQUINOX 100 coupled with Anton-Parr BTS500 chamber to portray the innovative cost-effective solution for material scientists.
Instrument
The Thermo Scientific™ ARL™ EQUINOX Series depicts a collection of XRD instruments from simple, easy-to-use bench-top systems for routine studies to more sophisticated high-performance, floor-standing, research-grade systems for investigative laboratories.
The ARL EQUINOX 100 is equipped with a custom-designed micro-focus tube (15 W for Co or 50 W for Cu), which eliminates the need for using an external water chiller. It is possible to transport the same unit between laboratories or into the field, and there is no need for any special infrastructure.
In contrast to other diffractometers, the ARL EQUINOX 100 enables very fast data collection times owing to its distinctive curved position sensitive detector (CPS) that has the ability to simultaneously measure all diffraction peaks in real time.
The fastest benchtop XRD for dynamic studies can be achieved by coupling the ARL EQUINOX 100 with the Anton Paar BTS500 high-temperature chamber. With very low power requirements of less than 250 W and a very small form factor, it would be possible to very easily analyze phase transitions, or chemical reactions, with complete computer manipulation of the ARL EQUINOX 100 itself but also on the high-temperature chamber.
A quick experiment, less than 3 hours from start to 3D result plot, was performed to illustrate the performance of this system.
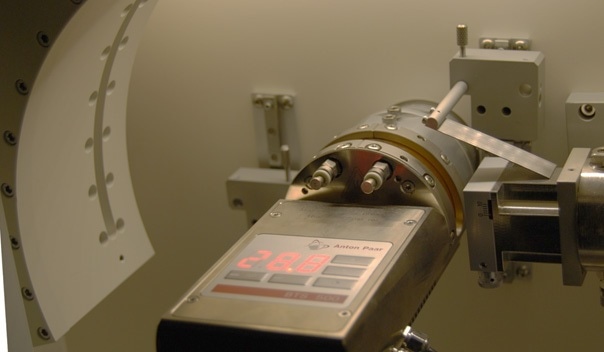
Figure 1. BTS500 chamber into the ARL EQUINOX 100
Experimental Conditions
RbNO3 powder, as received from the supplier (alfa aesar, 13496, 99% purity) was used in a BTS500 nickel sample cup for these analyses.
A batch run was prepared with the help of the Symphonix software as follows:
This suggests that the curved detector, which allows a complete XRD pattern to be obtained over 110° all the time, enables obtaining a new pattern every two minutes, where the pattern covers the total angular range. A new pattern like this can be obtained every 4 °C without the need for doing any dwell.
A copper minisource coupled with SmartOptics, running at 36 W power (40 kV, 0.9 mA), was used on the ARL EQUINOX 100. Throughout the entire experiment, a live display of the on-going full XRD pattern can be achieved.
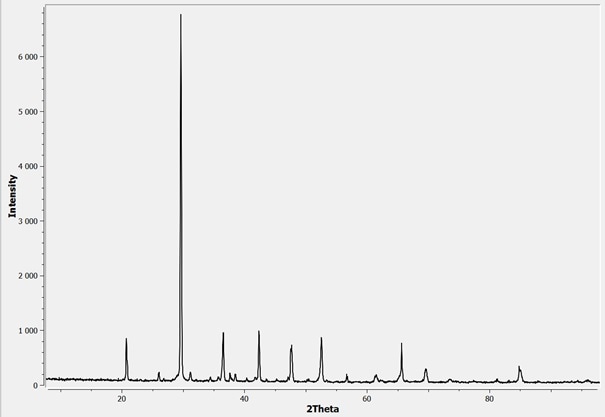
Figure 2. Typical RbNO3 pattern obtained in two minutes at room temperature
Results
A number of phase transitions are exhibited by rubidium nitrate between room temperature and 310 °C, the melting temperature.
If all the patterns obtained are plotted from room temperature up to 350 °C, the following image is obtained (the 20 to 70° 2θ region was zoomed in on, which is more interesting, but the full angular range is always available with a curved detector).
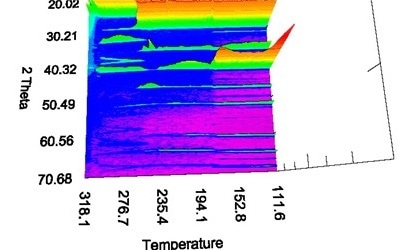
Figure 3. Rubidium nitrate patterns obtained from temperature up to 350 °C
It is evident that the pattern varies a number of times during the experiment.
At ambient temperature, rubidium nitrate has a trigonal structure up to about 160 °C. Subsequently, it suddenly changes to another structure, which is known to be cubic.
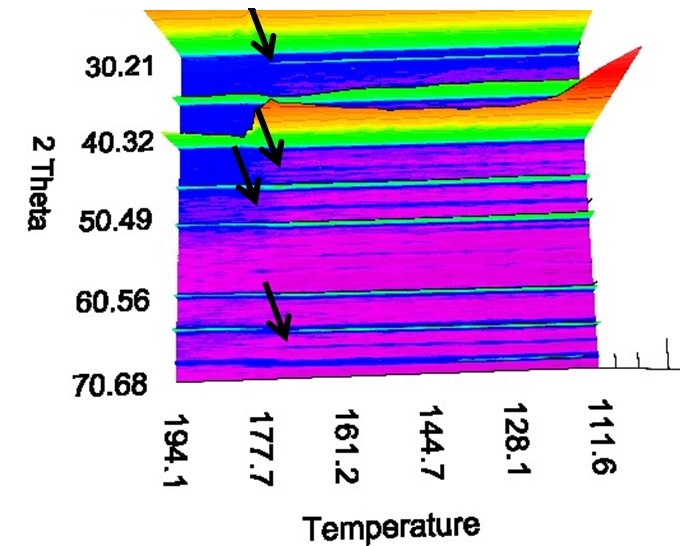
Figure 4. Trigonal structure of rubidium nitrate at temperature around 160 °C
A closer look at about 165 °C reveals that the small peaks between the higher ones disappear at around 170 °C.
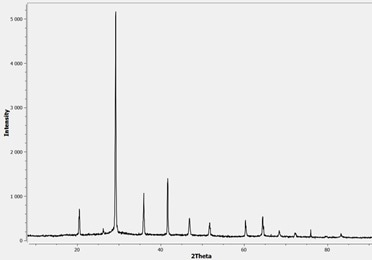
Figure 5. Rubidium nitrate pattern saved at 181 °C
As reported in earlier studies, phase transitions illustrated here occur at higher temperatures. However, as no dwells are performed around the phase transition temperature, and due to the fact that the sample is heated from the bottom, using the X-rays, more time is needed before the top of the surface can be effectively observed in the diffraction pattern. The experiment performed here should be regarded as a fast screening before repeating the measurements with considerably slower speed around the phase transition temperature.
A second phase transition is observed at higher temperatures, of about 250 °C in this experiment (wile reported at 219 °C in the literature). It can be clearly observed while switching from cubic to rhombohedral.
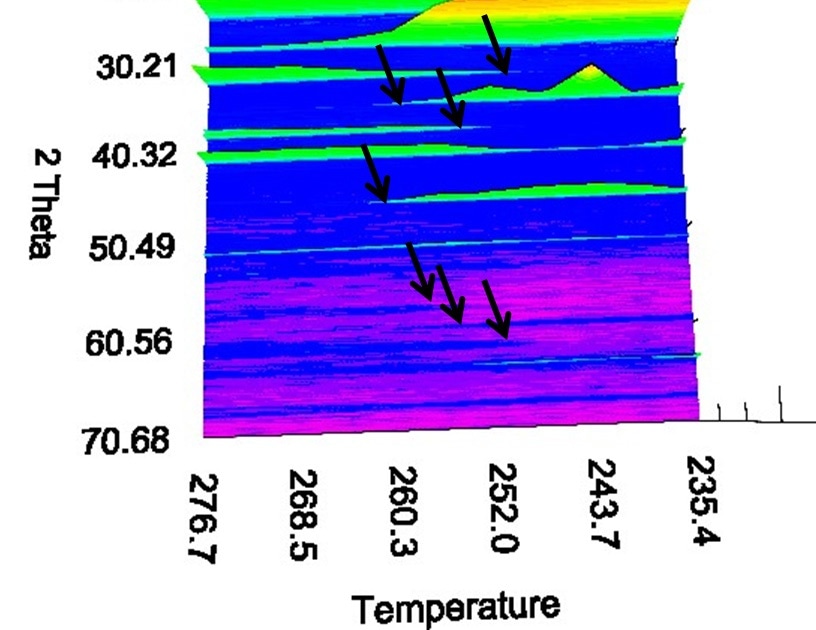
Figure 6. Rubidium nitrate patterns at around 250 °C
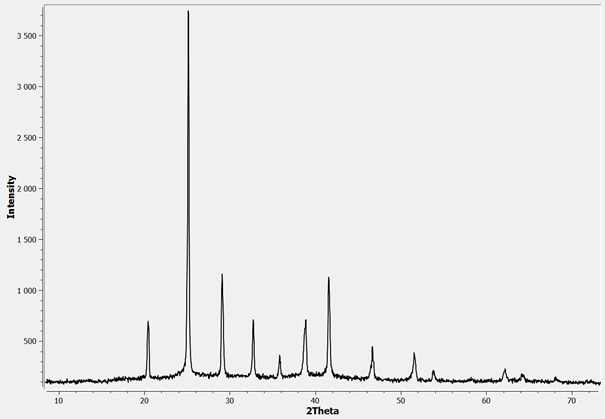
Figure 7. Rubidium nitrate pattern saved at 260 °C
The ARL EQUINOX 100 provided with a BTS500 high-temperature chamber can be used to observe four familiar structures of RbNO3 within 3 hours and 10 clicks.
The subsequent step would be to quickly ramp around approximately known phase transition temperatures and then gradually record the sample for every degree change, to achieve a better view at accurate temperatures of phase transitions.
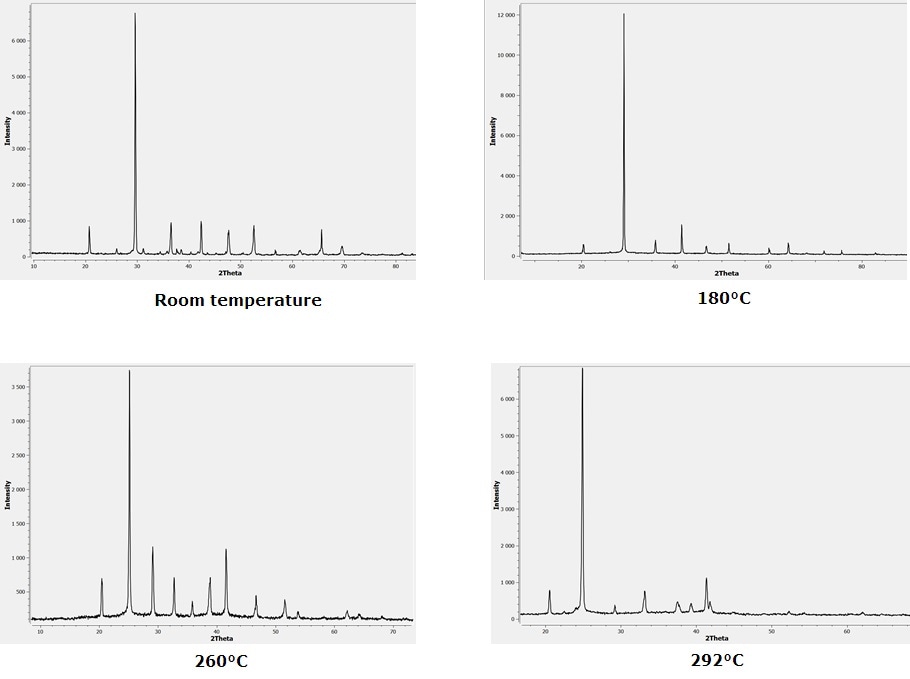
Figure 8. Rubidium nitrate pattern saved at various temperatures
******************************************
For more infomation, please contact:
Red Star Vietnam Co., Ltd.
Email: info@redstarvietnam.com