Crops have different levels of tolerance to salinity. Testing soil salinity is the best way to check soil condition in the orchard before salt damage occurs. The EC1:5 test is used to estimate soil salinity (ECe ). The soil salinity threshold value for almond is 1.5 mS/cm.
Introduction
Soils with high concentration of salts can induce salinity stress and restrict the growth of salt-sensitive plants. Among the factors that can cause salinity stress (See Figure 1), toxicity of ions, usually sodium (Na), chloride (Cl), and boron (B), is the most common that result in leaf tissue damage. In the orchard, the most typical salt damage observed is “leaf-tip burn” (See Figure 2) and the best way to prevent it is by monitoring the soil salinity. The advantage of soil salinity monitoring is remedial action can be performed on soil before symptoms on leaf tissue appear. Annual testing of soil samples from selected locations in the orchard should be part of every growers’ management program.
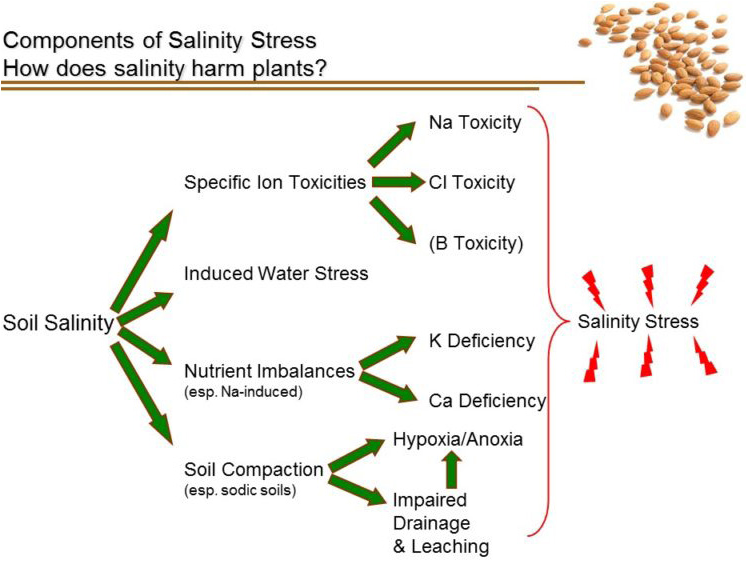
Figure 1: Components of Salinity Stress Source: Rosenzweig, B. (2016). Soil Salinity Management.
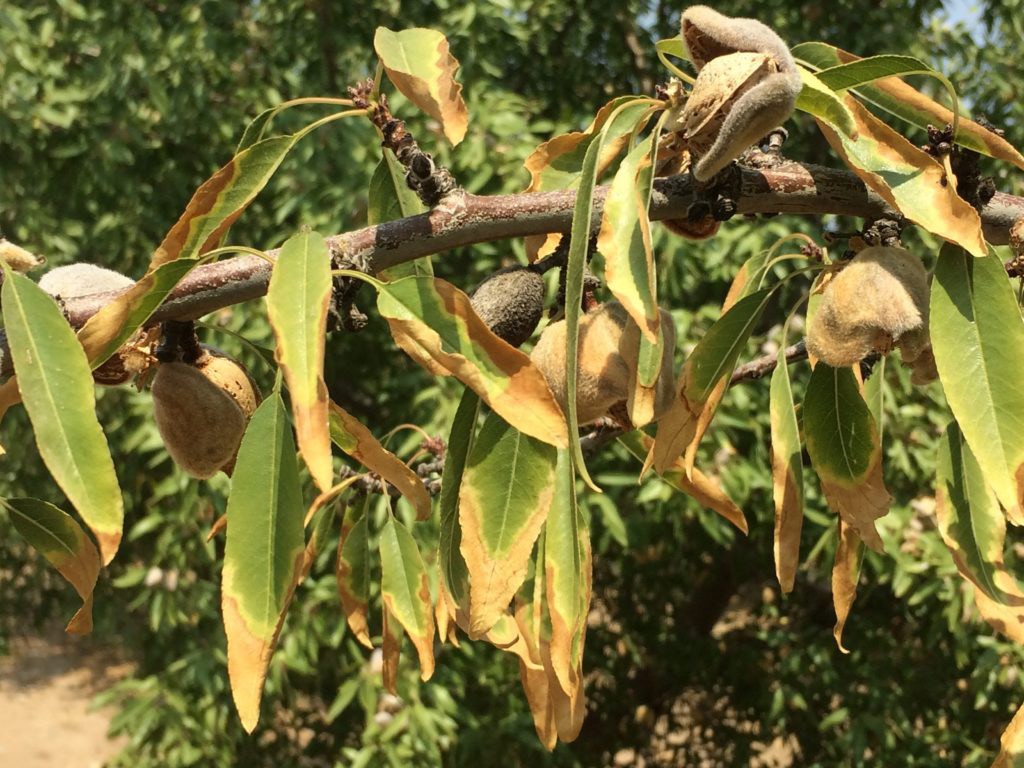
Figure 2: Leaf-tip Burn in Almond Orchard Source: Rosenzweig, B. (2016). Soil Salinity Management.
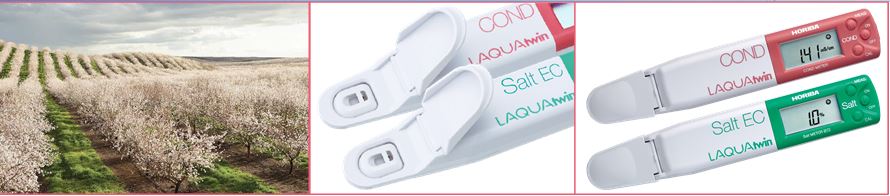
Electrical conductivity (EC) is the method used to measure soil salinity, which is influenced by the concentration and composition of dissolved salts. Salts increase the ability of a solution to conduct an electrical current, so a high EC value indicates high salinity. The LAQUAtwin EC 11, 22 and 33 conductivity pocket meters measure electrical conductivity in drops or micro-volume samples and display reading in just few seconds. The replaceable sensor is made of two flat titanium metals coated with platinum black that resist corrosion. The meters are programmed with standard recognition function for automatic calibration and automatic temperature compensation (ATC) function for accurate measurement.
Electrical conductivity (EC) is the method used to measure soil salinity, which is influenced by the concentration and composition of dissolved salts. Salts increase the ability of a solution to conduct an electrical current, so a high EC value indicates high salinity. The LAQUAtwin EC 11, 22 and 33 conductivity pocket meters measure electrical conductivity in drops or micro-volume samples and display reading in just few seconds. The replaceable sensor is made of two flat titanium metals coated with platinum black that resist corrosion. The meters are programmed with standard recognition function for automatic calibration and automatic temperature compensation (ATC) function for accurate measurement.
Method
A. Soil Sample Collection
Select representative sites in the orchard for routine sampling.
Drip Irrigated Orchards
Collect double handful of soil from two locations—20cm from the dripper and on the edge of the wetted area ~ approx. 60cm from the dripper. Soil should be drawn from two or three depths in the root zone—every 30cm down to 1m. Place soil sample from each depth/ location in a bag for analysis.
Sprinkler Irrigated Orchards
The sampling is similar to that of drip irrigated orchards, except three locations are sampled—2meters of a sprinkler, 1/3 distance between sprinklers on a diagonal, and middle of the sprinkler pattern. If the irrigation system has a designed and measured distribution uniformity of ≥ 80% or salinity results from 2 or more years indicate there is no variation by location, then the number of locations could be decreased.
B. Soil Salinity Measurement
1. Allow the soil sample to dry by leaving the sample bag or container open for at least a day. It can be oven-dried on a tray in a cool oven.
2. Crush dried sample with a mortar and pestle, rolling pin or hammer so there are no large aggregates (clods of soil 2mm or larger). Remove any foreign matter, plant matter, and stones from the sample.
3. Add 1 part soil for every 5 parts distilled or deionized (DI) water. For example, mix 50g soil and 250ml DI water in a container.
4. Shake the container for 3 minutes to dissolve the salts. For clay loams and clay soils, more shaking (for 1 minute every 3 minutes, repeat 3 times) will dissolve more salts and increase the accuracy of the test.
5. While allowing the solution to settle for a minute before testing, calibrate the LAQUAtwin EC 11, 22 or 33 pocket meter with 1413µS/cm and 12.88mS/cm conductivity standards included in the kit. Rinse the conductivity sensor with DI water and blot dry with soft tissue between standards and after calibration.
6. Immerse the conductivity sensor in the solution (without touching the soil in the bottom of the container) and record the EC1:5 reading once it has stabilized. Alternatively, place drops of solution onto the sensor using the pipette included in the kit.
7. Rinse the conductivity sensor with DI water and blot dry with soft tissue.
8. Convert the EC1:5 reading to actual soil salinity (ECe ) by multiplying the value by the conversion factor based on the texture of the soil sample (Refer to Table 1 below).
Table 1: EC1:5 to ECe Conversion Factors
|
Soil Texture |
Multiplication Factor |
|
Sands |
17 |
|
Sandy Loams |
13.8 |
|
Loams |
9.5 |
|
Clay Loams & Light Clays |
8.6 |
|
Medium & Heavy Clays |
7 |
Note: These factors are calibrated for southern NSW (AU) soils Source: Gibbs, S. (2000).Salinity Notes: How to Texture Soils & Test for Salinity.
Results and Benefits
Monitoring soil salinity can help identify the current soil conditions, predict problems, and establish baseline for management decisions. Crops have different levels of tolerance to salinity. The soil salinity threshold value for almond is 1.5 mS/cm. Table 2 below shows the salt tolerance data for selected crops.
Soil salinity derived from electrical conductivity (EC) measurements in the field or laboratory are often reported with subscript abbreviations to indicate the origin of the sample tested and the method used to determine the salinity. Common abbreviations and their descriptions are explained below.
A soil salinity test gives an indication on the soil conditions around the plant roots, taking into account the influence of soil texture. Texture is an estimate of the relative amounts of sand, silt, and clay particles in a soil. It affects fertility, water holding capacity, internal drainage, irrigation scheduling, and soil workability for tillage. Soil texture usually changes with depth. To guide you identify soil texture, refer to Salinity Notes: How to Texture Soils & Test for Salinity by Simon Gibbs.
Table 2: Salt Tolerance Data for Selected Crops
|
Crop |
Soil Salinity ECse (mS/cm)* |
|||
|
0% Yield Loss |
10% Yield Loss |
25% Yield Loss |
50% Yield Loss |
|
|
Almond |
1.5 |
2.0 |
2.8 |
4.1 |
|
Avocado |
1.3 |
1.8 |
2.5 |
3.7 |
|
Citrus |
1.7 |
2.3 |
3.3 |
4.8 |
|
Date Palm |
4.0 |
6.8 |
11.0 |
18.0 |
|
Lucerne |
2.0 |
3.4 |
5.4 |
8.8 |
|
Olive |
2.7 |
3.8 |
5.5 |
8.4 |
|
Onion |
1.2 |
1.8 |
2.8 |
4.3 |
|
Pistachio |
4.0 |
4.5 |
5.0 |
6.0 |
|
Pomefruit |
1.7 |
2.3 |
3.3 |
4.8 |
|
Potato |
1.7 |
2.5 |
3.8 |
5.9 |
|
Stonefruit |
1.7 |
2.2 |
2.9 |
4.1 |
|
Tomato |
2.5 |
3.5 |
5.0 |
7.6 |
|
Vine |
1.5 |
2.5 |
4.1 |
6.7 |
|
Beans |
1.0 |
1.5 |
2.3 |
3.6 |
|
Eggplant |
1.1 |
2.5 |
4.7 |
8.3 |
|
Cucumber |
2.5 |
3.3 |
4.4 |
6.3 |
|
Capsicum |
1.5 |
2.2 |
3.3 |
5.0 |
*Equivalent to dS/m Source: Irrigation Management Training. Measuring Soil Salinity
References and Suggested Readings
1. Rosenzweig, B. (2016). Soil Salinity Management. Available at https://growing.australianalmonds.com.au/2016/02/28soil-salinity-management/ (Accessed 30 December 2016).
2. Gibbs, S. (2000). Salinity Notes: How to Texture Soils & Test for Salinity. Number 8, ISSN 1 325-4448. Available at http://www.dpi.nsw.gov.au/__data/assets/pdf_file/0008/168866/ texture-salinity.pdf (Accessed 30 December 2016).
3. NSW Government Department of Primary Industries. How salinity is measured. Available at http://www.dpi.nsw.gov.au/land-and-water/soils/salinity/general-information/measuring (Accessed 30 December 2016).
4. Irrigation Management Training. Measuring Soil Salinity. Available at http://www.growingcapsicums.com.au/pdf/6_salinity/measuring_soil_salinity.pdf. (Accessed 23 January 2017).