Introduction
We perform comparative analysis for three over-the-counter products. Although even if main components of drug are same, the drugs become different due to the other factors such as diluent base, preservation agent and process of manufacture occasionally. And also, it is rare case, but it should be possible to consider pure grade of main components. We can observe the minute-difference between three over-the-counter products because of analyzing the detail of thermal cracking process for drugs in inert atmosphere using the combination of thermogravimetry (TG) and mass spectrometer (MS).
Instrument
Themomass Photo
ThermoMass Photo is an evolved gas analytical system designed for real-time simultaneous measurements of thermogravimetry – differential thermal analysis (TG-DTA) coupled with electron impact ionization (EI) and the fragment-free photoionization (PI) mass spectrometry (MS) that performs measurements as a function of temperature or time.
Measurement and analysis
A comparison between the results from over-the-counter drug A, two types of medicinal drug B and C, major component is loxoprofen sodium hydrate for anti-inflammation and painkiller, employed TG-MS is shown in Fig.1.
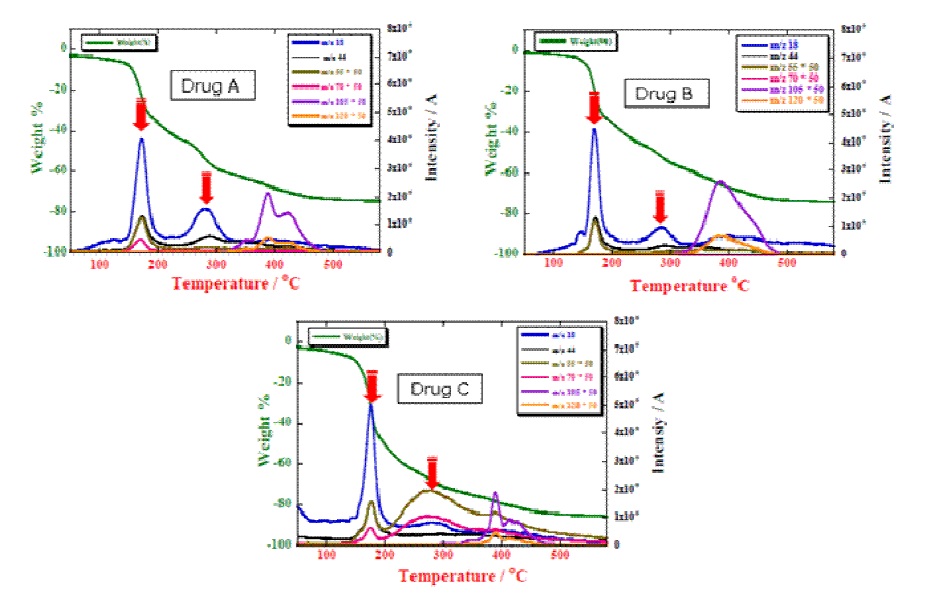
Figure 1: Comparison of TG-MS curves and mass spectra for OCT drugs
These mass spectra show that the evolved gas species were characterized by the m/z 18, 55, 70, 105 and 120 ions which indicate decomposition components of drug. While the TG measurement results show three steps of mass losses. When look over each drug, the decomposition component of drug A can be observed in two steps of dehydration (m/z 18) at 156℃ and 280℃ while generated CO2 (m/z 44) at 285℃.
On the other hand, 2nd step of dehydration of drug B, the dehydration peak intensity decreased and generated CO2 were became less. Furthermore, the drug C, there was observed the evolved gas species characterized by m/z 55 and 70 ions prominently, instead of no peak intensities of dehydration at 2nd step and CO2.
We assume that these difference of decomposition components due to the difference of diluting agents. From measurement results reveal that the difference of decomposition components were characterized clearly which measuring evolved gas of mass by the mass analyzer while the difference of decomposition reactions can not distinguish by TG.
Support documentation
Comparison analysis of XRD data for OCT drugs
A comparison between three drugs of XRD data profiles is shown in Fig.2.
The observed diffraction peaks seem small difference at those drugs, these differences might be originated in crystal polymorph or components (see ◆ points).
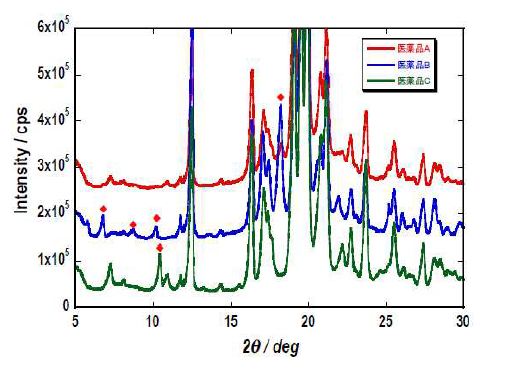
Figure 2: Comparison of XRD profiles curves for OCT drugs, red line for drug A, blue line for drug B and green line for drug V
XRD measurement condition:
.