Introduction
Thermogravimetry-Mass spectrometry (TG-MS) is a crucial analytical system for the investigation of thermal decomposition, H2O contents, and reaction process under the certain temperature.
In this investigation, we detected the evolved gases from acetylsalicylic acid upon heating by Thermo Mass Photo. Furthermore, we estimated the activation energy and the reaction time.
Instruments
Thermo Mass Photo
Thermo Mass Photo is a versatile measurement system of thermogravimetry-differential thermal analysis (TG-DTA) and photoionization mass spectrometry (PIMS). In this system, weight change, endothermic or exothermic phenomena, and evolved gases can be analyzed simultaneously. Therefore, Thermo Mass Photo is considered a promising analytical tool for fundamental research, qualification control, and development of new materials.
Thermo Mass Photo has a unique interface, called skimmer type interface, which transfers evolved gases efficiently. We can select Photoionization (PI) as well as Electron ionization (EI) on the mass spectrometer. The combination of PI and EI enables us to identify the gases easily.
Experimental
Acetylsalicylic acid was loaded into Al pans with 4mg, and heated at 20 ºC/min under He atmosphere. Their reactions were monitored by TG, DTA, and MS in Thermo Mass Photo.
This measurement was repeated with change in the heating rates of 5, 10, 15, and 20°C/min to evaluate the kinetic analysis.
Results and Discussion
Upon heating of acetylsalicylic acid under inert atmosphere of He, two-step weight losses were observed in Fig. 1.
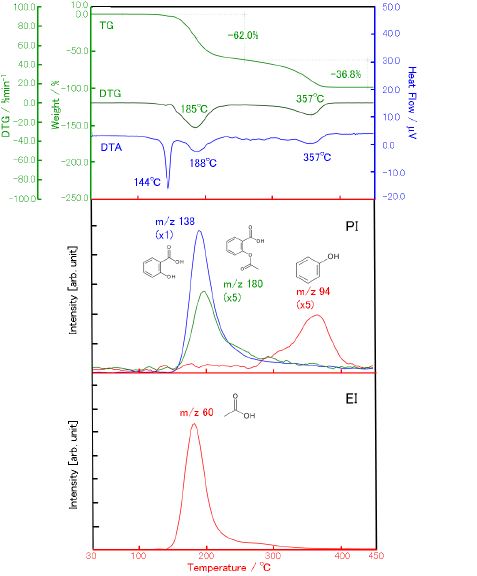
Figure 1: TG-DTA profile and MS ion thermogram of acetylsalicylic acid.
In the temperature range of the first weight loss (120-250 ºC), we observed the two endothermic peaks at 144 and 188 ºC in the DTA curve. In addition, we detected the ions for salicylic acid, acetylsalicylic acid, and acetic acid In MS. The endothermic peak at 144 ºC is attributed to the fusion of acetylsalicylic acid.
The peak at 188 ºC is considered due to the sublimation or evaporation of acetylsalicylic acid and the thermal decomposition, which generates salicylic acid and acetic acid.
In the temperature range of the second weight loss (250-400 ºC), we observed the endothermic peak at 357 ºC in DTA and the ion for phenol in MS. Phenol is generated by the thermal decomposition.
The curve-shape of the thermal analysis dependent of the heating conditions reflects the kinetics of the reaction. This information has been widely utilized for estimation of reactivity and stability of materials, such as lifetime. Generally, TG curves have been applied to the kinetic analysis. However, TG curves are not appropriate if the multiple reactions occur in the same temperature range such as the first weight loss in this measurement. We recommend that the thermal profiles of evolved gases are applied to the kinetic analysis of the multiple reactions. This analysis provides the specified information on the reaction products.
 |
|
|
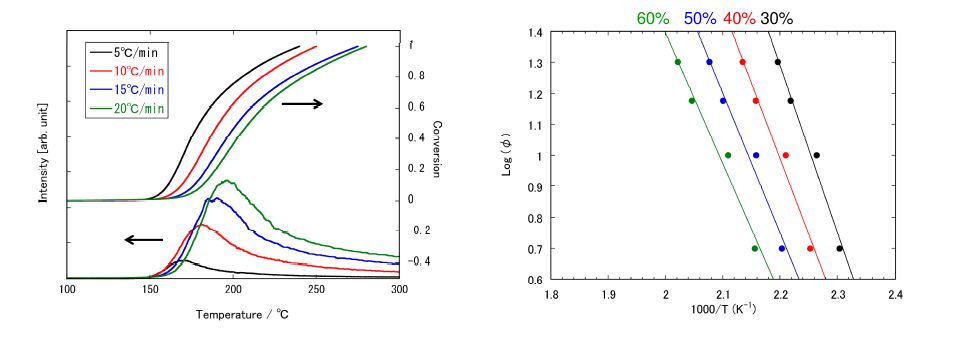
Figure 2: MS ion thermogram of m/z 138 (PI)and its conversion profile. |
Figure 3: Flynn-Wall-Ozawa plots for generationof salicylic acid. |
The activation energy of the reaction for the generation of salicylic acid was calculated from the MS ion thermogram of the m/z 138 ion in PI, corresponding to the molecular ion of salicylic acid. Figure 2 shows the MS ion thermogram of m/z 138 with changing of the heating rates. In addition, the reaction rate derived from the integration of the signal intensity is also shown in Fig. 2. The reaction rate allows us to form the Flynn-Wall-Ozawa plots as shown in Fig. 3. The activation energy was 89kJmol-1 at the reaction rate of 40% where the generation of salicylic acid becomes maximum. We can estimate the reaction time of 6849 hours (285 days) required for this reaction rate at 25 ºC.