Sự phân bố không gian của các nguyên tố vi lượng (nguyên tố nhẹ) trong đá và các khoáng sản là mối quan tâm lớn của các nhà địa chất. Ví dụ trong đá lửa, các nguyên tố vi lượng là chất đánh dấu hữu ích đối với các nguồn đá magma và các quá trình địa chất ảnh hưởng tới quá trình tiến hóa của đá magma. Kỹ thuật chùm điện tử sử dụng WDS là công cụ tiên tiến, hiện đại nhất cho việc nghiên cứu, khảo sát tại chỗ như vậy [1].
Trong bài viết này chúng tôi trình bày một nghiên cứu về sự phân bố các nguyên tố nhẹ và nguyên tố nặng trong plagiocla (Fenspat natri-canxi), loại khoáng chất hình thành đá phổ biến nhất. Stronti, một nguyên tố vi lượng trong plagiocla được đặc biệt quan tâm bởi vì nó có thể được sử dụng cho việc đo thời gian khuếch tán hoặc cho các nghiên cứu về quá trình nóng chảy tinh thể [2],[3].
Thách thức phân tích trong trường hợp nghiên cứu trên không chỉ liên quan đến nồng độ thấp của nguyên tố quan tâm (Sr<1000ppm), mà còn liên quan đến sự chồng chập các định riêng biệt của Si Kα và Sr Lα trong phổ EDS.
Mẫu
Mẫu được phân tích là một tảng đá núi lửa từ Savo nằm trong quần đảo Solomon [4]. Savo là hòn đảo có núi lửa tầng dạng hình cung, với hai phần ba diện tích hình nón bên dưới đại dương và một phần ba còn lại nhô ra như hòn đảo. Mẫu là một khoáng chất Trachit (một loại đá núi lửa giàu tinh thể với thành phần trung gian chủ yếu là natri) từ miệng núi lửa. Mặc dù không thể biết chính xác được tuổi của mẫu nhưng nhiều vật liệu ở Savo đã bị phun trào trong 400 năm qua.
Các điều kiện của phép đo
Các phép đo được thực hiện trong máy FE-SEM. Thiết bị FE-SEM này được trang bị cả quang phổ kế Bruker XFlash® ED và quang phổ kế Bruker Xsense® WD dùng môt chùm quang học tới song song. Nguyên tố vi lương Sr được xác định bởi WDS, tất cả những nguyên tố khác (nguyên tố nặng) được xác định bởi EDS. Chuẩn hóa ma trận được xác định bởi φ (ρZ).
Bảng 1: Tập hợp các điều kiện phép đo.
|
Thông số phép đo |
Giá trị |
|
Thế gia tốc |
15kV |
|
Dòng điện đầu dò |
90nA |
|
Đầu dò EDS |
XFlash® 6 l 10 |
|
Tín hiệu đầu ra |
480 kcps |
|
Đầu dò WDS |
XSense® |
|
Đường XRD nhận được bằng WDS |
Sr Kα |
|
Sự nhiễu xạ qua tinh thể |
PET |
|
Thời gian thu nhận tín hiệu |
10 h |
Kết quả
Đá núi lửa pofirit chứa phong phú các khoáng vật fenspat, biến đổi từ thành phần giàu natri (đá mặt trăng, NaAlSi3O8) đến những khoáng vật plagiocla tương tự có thành phần giàu canxi (đá xà cừ, Na0.4Ca0.6Al1.6Si2.4O8). Hình 1 thể hiện kết cấu Pofirit cùng với plagiocla như là pha tinh thể ban chiếm ưu thế.

Hình 1: Bản đồ phân bố các nguyên tố Al, K và P trong mẫu được phân tích. Hàm lượng Al cao đặc trưng cho khoáng chất plagiocla, trong khi nguyên tố K phân bố xung quanh chất nền và một vài biotit. Apatit là rõ ràng vì hàm lượng Ca cao. Dữ liệu EDS thu được đồng thời với đầu dò WDS.
Phổ EDS của plagioclac cho thấy các đỉnh cao nổi bật lên như Si, Al và O bên cạnh các đỉnh có độ cao thấp hơn như Na, Ca (hình 2a). Mặc dù Sr tồn tại trong plagiocla nhưng không thể xác định được từ phổ EDS.
Việc khó xác định như vậy là do các vấn đề sau:
Việc sử dụng phương pháp dựng đỉnh phổ chồng chập rất phức tạp. EDS có thể phát hiện được Sr dựa trên sự điều khiển thủ công của người phân tích. Tuy nhiên, tốc độ đếm rất thấp và định lượng của nguyên tô vi lượng như Sr bị chồng chập với nguyên tố chính như Si mang lại kết quả không chính xác với sai số lớn.
Trong khi đó, WDS có thể thu được cả đỉnh Sr L ở cường độ thấp trong phổ tia X của plagiocla (Hình 2b). Quá trình quét dải năng lượng thu được khi sử dụng WDS chỉ ra rõ ràng đỉnh Sr Lα (1.806 keV) nằm ở giữa đỉnh Si Kα (1.740 keV) và Si Kβ (1.837 keV).
Độ phân giải của QUANTAX WDS được áp dụng tại vùng năng lượng quan tâm là 3.5 eV (FWHM của Si Kα). Điều này có nghĩa là độ phân giải đã được cải thiện gấp 20 lần so với EDS. Tỉ lệ cường độ của đỉnh Sr Lα và đỉnh Si Kα là 1:170 thể hiện trong phổ WDS (hình 1b). Đỉnh nhỏ ở 1.819 keV là Si Kβ’, một dòng vệ tinh năng lượng thấp của Si Kβ.
Việc áp dụng phương pháp giảm phổ nền và sử dụng SrF2 nhưlà vật liệu tham chiếu để định lượng dựa trên tiêu chuẩn của điểm phân tích được lựa chọn, nồng độ Sr lên tới 0.1% đã được xác định bởi WDS cho các plagiocla giàu canxi nhất.
Tinh thể ban plagiocla trong đá đươc nghiên cứu thường cho thấy có nhiều vùng và đôi khi có các vùng phức hợp (hình 3). Hàm lượng Ca cao (Labradorit, Na0.4Ca0.6Al1.6Si2.4O8) là đặc trưng của lõi tinh thể và có thể lặp đi lặp lại trong các tinh thể được phân vùng. Các plagiocla nhận được nhiều Na (albite , NaAlSi3O8) ở phía mép rìa của chúng. Vì vậy, các vùng có hàm lượng Na hoặc Ca cao chắc chắn là trái ngược nhau.
Phổ Tia X của plagiocla
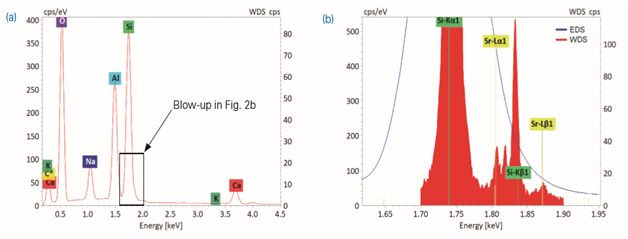
Hình 2: Phổ tia X của plagiocla trong mẫu khảo sát thu được bằng phân tích EDS (a) và kết hợp EDS-WDS (b). Hình 2b cho thấy phần phóng đại của phổ tia X trong vùng quan tâm trong khoảng giữa 1.6 – 1.95 keV, tại đó phổ EDS được thể hiện bằng màu đỏ và dải năng lượng quét WDS bằng màu nâu.
Sự phân bố không gian của các nguyên tố vi lượng Sr bên trong plagiocla được xác định bằng bản đồ WDS. Bản đồ thành phần (hình 3.1, b) thể hiện nồng độ Sr cao nhất có tương quan tốt với vùng giàu Ca trong tinh thể Plagiocla.
Thảo luận
Plagiocla trong các mẫu ghi lại sự phát triển tinh thể trong quá trình tiến hóa và đi lên của magma, và thường được phân vùng một cách ngoạn mục từ thành phần có chứa canxi đến thành phần có chứa natri. Sự phân vùng không cân xứng của các khoáng vật lửa thường được giải thích bởi sự bắt nguồn từ hệ thống magma tồn tại lâu đời cùng với nhiều lần bổ sung bởi sự tan chảy của vỏ mafic.
Trong khi đó, hàm lượng Ca cao chỉ ra rằng magma nguyên sinh được phun vào lò magma và góp phần vào sự phát triển của tinh thể plagiocla, các tinh thể này trở nên giàu Na hơn trong suốt quá trình phân đoạn kết tinh tiếp theo [5].
Các kết quả hiện nay về sự phân bố của Sr chứng minh rằng lượng nguyên tố vi lượng của Stroti có thể thay thế cho Canxi trong mạng tinh thể của plagiocla. Thêm nữa, các phát hiện này chỉ ra rằng magma nguyên sinh có liên quan đến việc hình thành núi đá lửa hiện tại đã được làm giàu khá nhiều bởi Sr.
Bản đồ thành phần của một plagiocla
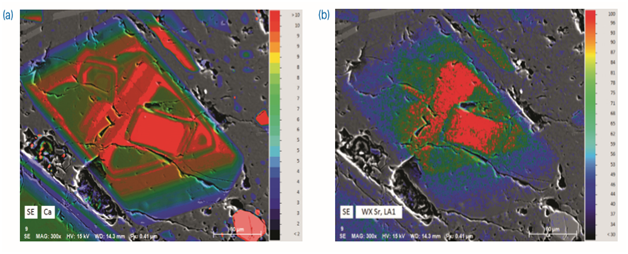
Hình 3: Các bản đồ định lượng thành phần của một plagiocla phân vùng phức tạp được trình bày trong bảng màu pallet (kích thước bản đồ 314μm x 245μm). Bản đồ (a) thể hiện sự phân bố của nguyên tố chính Ca thu được từ dữ liệu EDS. Bản đồ (b) thể hiện sự phân bố của các nguyên tố vi lượng stronti thu được từ WDS.
Kết luận
Kỹ thuật chùm tia điện tử cho phép thu nhận được ảnh vơi độ phân giải cao và phân tích định lượng thành phần của phân vùng trong khoáng sản. Các kết quả này thể hiện rõ ràng rằng QUANTAX EDX và QUANTAX WDS là những công cụ mạnh mẽ cho việc phân tích các mẫu địa chất, như plagiocla.
Được cài đặt trong cùng một thiết bị (FE-)SEM, hai quang phổ kế (EDS và WDS) bổ sung hữu ích cho nhau. QUANTAX WDS hoàn toàn phù hợp cho việc lập bản đồ và phân tích tại chỗ nguyên tố vi lượng Sr trong silicat. Kỹ thuật WDS là rất cần thiết, đặc biệt là trong những trường hợp phân tích mà trạng thái ở gần của các đường tia X trùng khớp với sự khác biệt rõ rệt về cường độ dòng.
Tài liệu tham khảo
[1] Ginibre, C., Wörner, G., Kronz, A. (2007): Crystal zoning as an archive for magma evolution. Elements, 3(4), 261-266.
[2] Blundy, J. D., Wood, B. J. (1991): Crystal-chemical controls on the partitioning of Sr and Ba between plagioclase feldspar, silicate melts, and hydrothermal solutions. Geochim. Cosmochim. Acta, 55, 193-209.
[3] Zellmer, G. F., Sparks, R. S. J., Hawkesworth, C. J., Wiedenbeck, M., (2003): Magma emplacement and remobilization timescales beneath montserrat: Insights from Sr and Ba zonation in plagioclase, Phenocrysts. J. Petrol., 44, 1413-1431.
[4] Smith, D. J., Petterson, M. G., Saunders, A. D. et al. (2009): The petrogenesis of sodic island arc magma at Savo volcano, Solomon Islands. Contrib. Mineral Petrol., 158, 785.
[5] Deer, W. A., Howie, R. A., and Zussman, J. (1992): An introduction to the rock-forming minerals, 2nd Ed., Longman, London.
Lời cám ơn
Chúng tôi xin trân trọng cám ơn tiến sĩ Daniel J. Smith, Trường Đại học Leicester, Vương Quốc Anh, đã cung cấp phần mẫu lát cắt mỏng và thông tin chi tiết về vị trí mẫu.
Tác giả
Dr. Michael Abratis, Senior Application Scientist WDS, Bruker Nano GmbH, Berlin, Germany